Plant-based study results
July 2, 2026
274 participants have completed the study. 219 participants attempted to reduce their animal product consumption (reduction group), while 55 were instructed to eat as normal to provide a control for comparison (comparison group).
We converted daily logs into grams of animal protein and compared what participants ate during the study against their self-reported usual consumption, and against the consumption of the comparison group. We also look at what tracked how much participants reduced, the difficulties they expected and encountered, and whether they plan to keep eating more plant-based.
These are our initial findings; we plan to develop them into a report with full statistical analysis and the 30-day follow-up results once all participants have responded.
The reduction group reduced much more
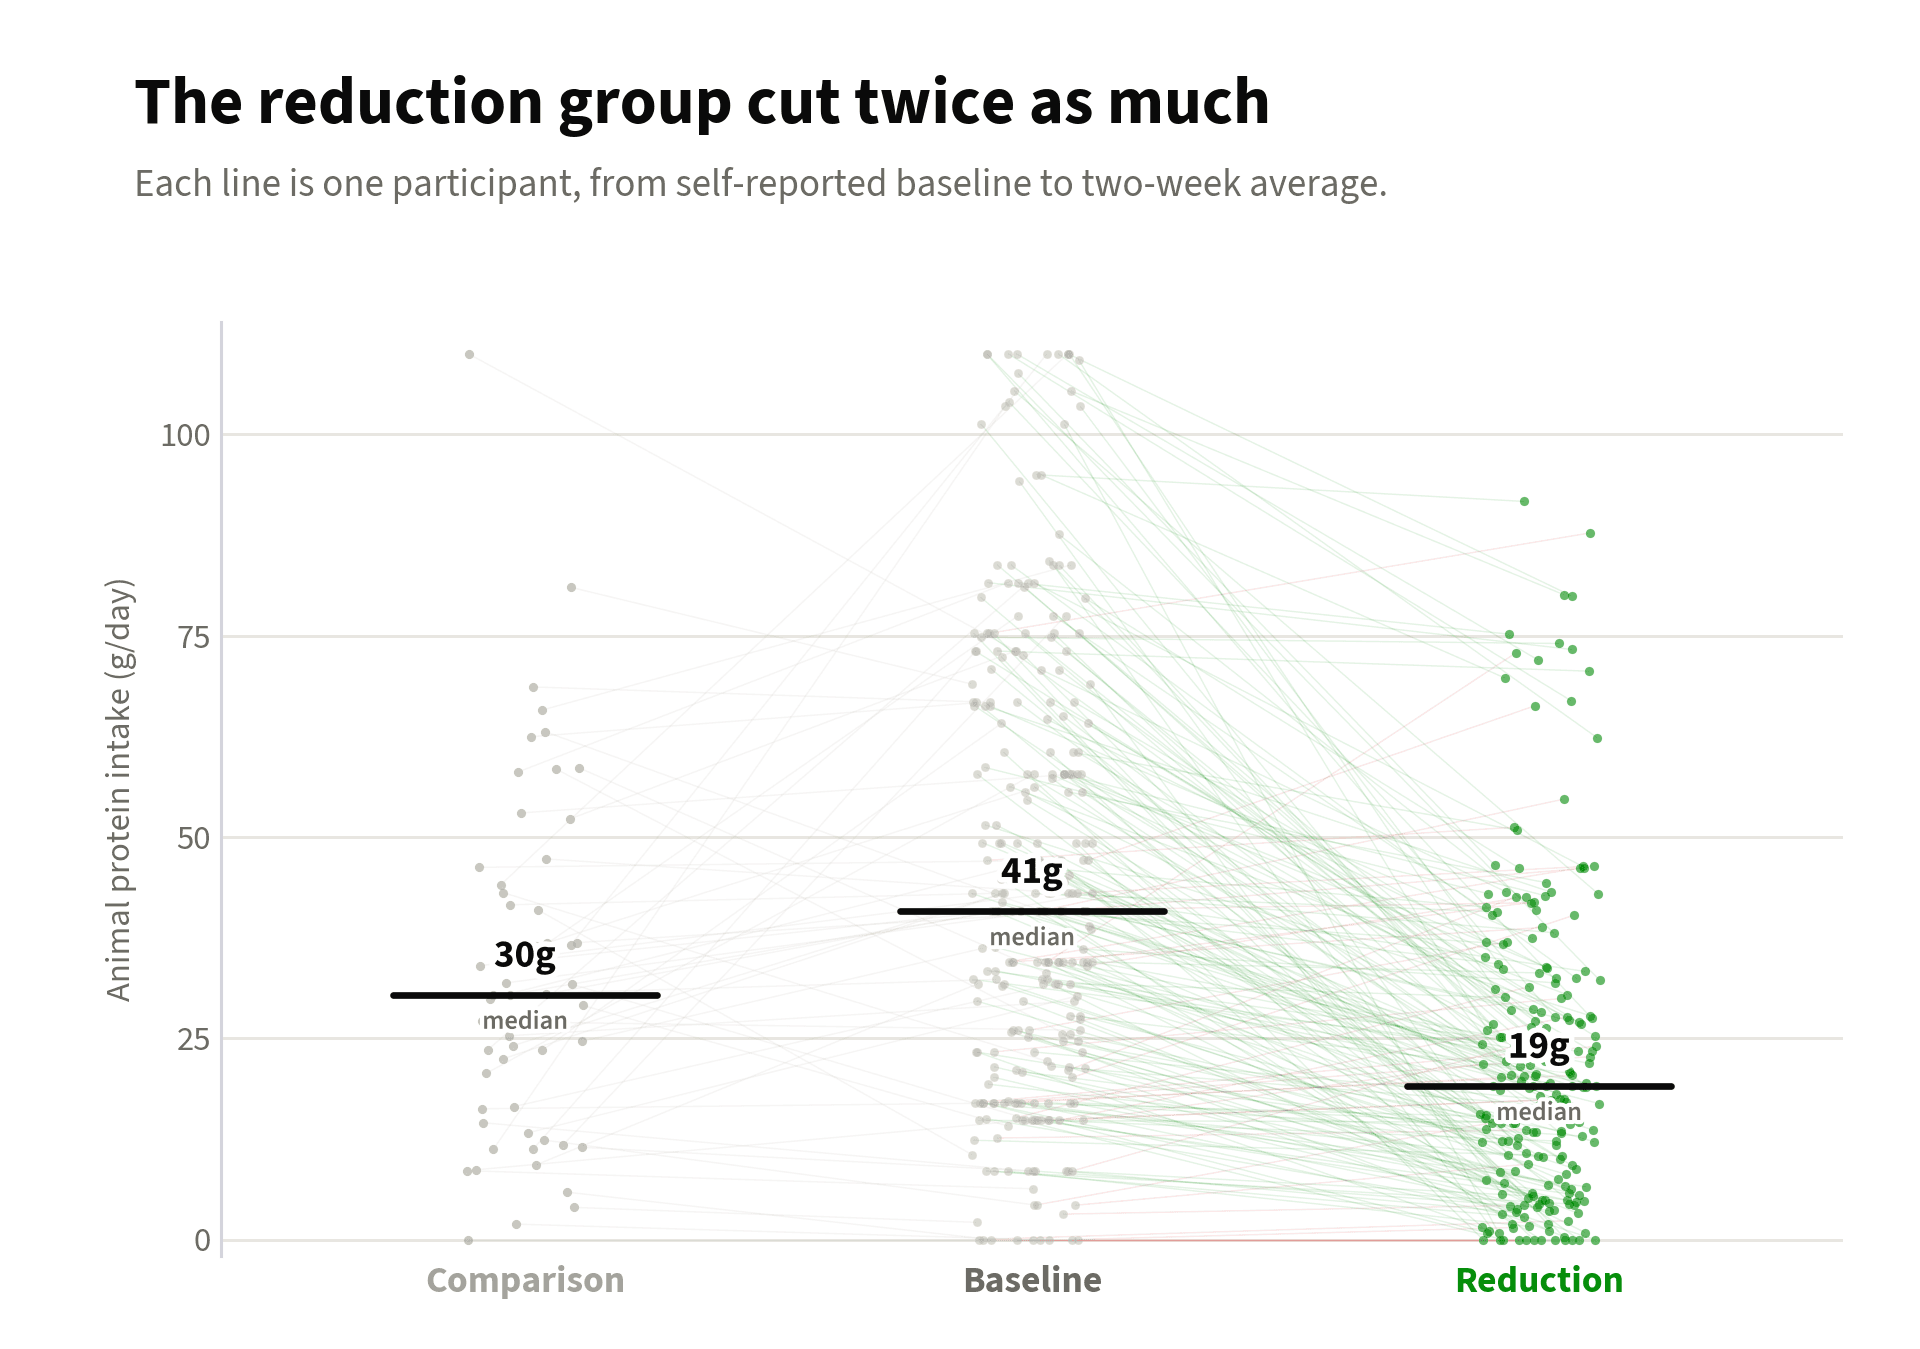
During the study, the reduction group cut their typical animal product consumption in half, from about 41 grams of animal protein a day to 19 grams a day. The comparison group reduced much less, from the same 41 grams a day to about 30 grams a day. We speculate this reduction comes from participants overestimating their animal product consumption and the comparison group reducing despite instructions to eat normally.
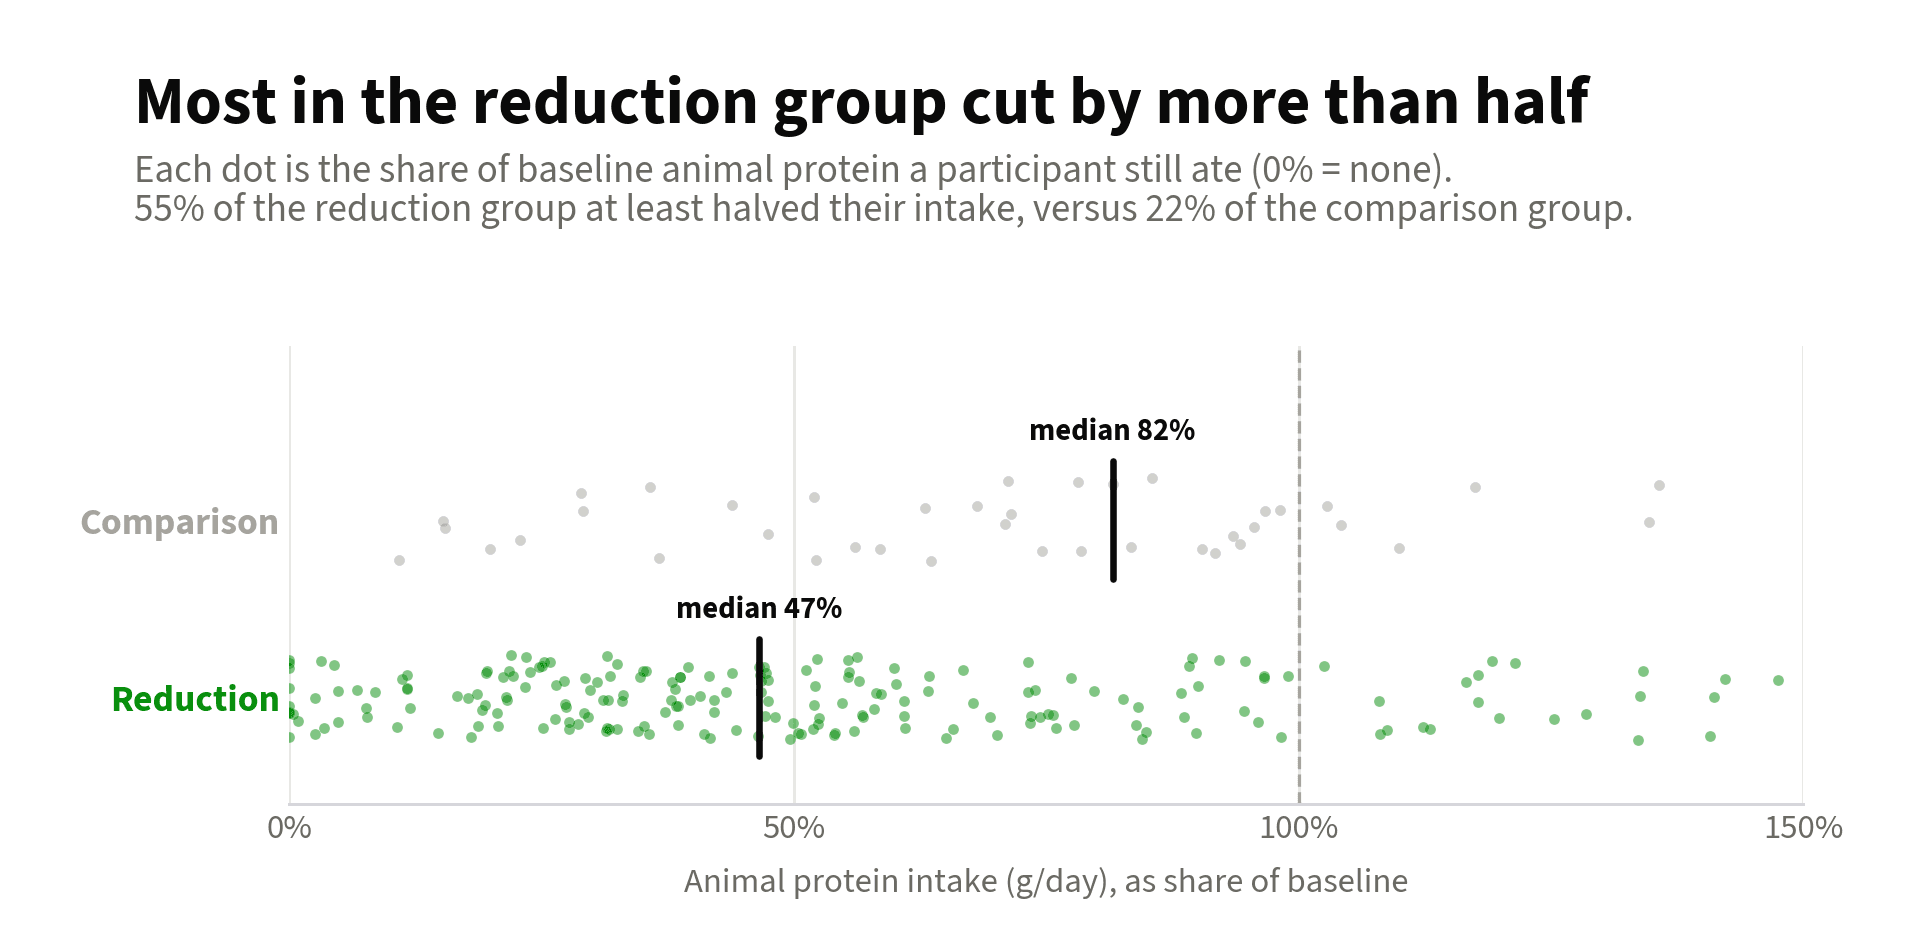
The difference between the two groups is clear when participant reductions are compared to their self-reports. During the study, the typical participant in the reduction group ate 47% of their self-report, compared to 82% for the comparison group.
Most participants were not surprised by the difficulty
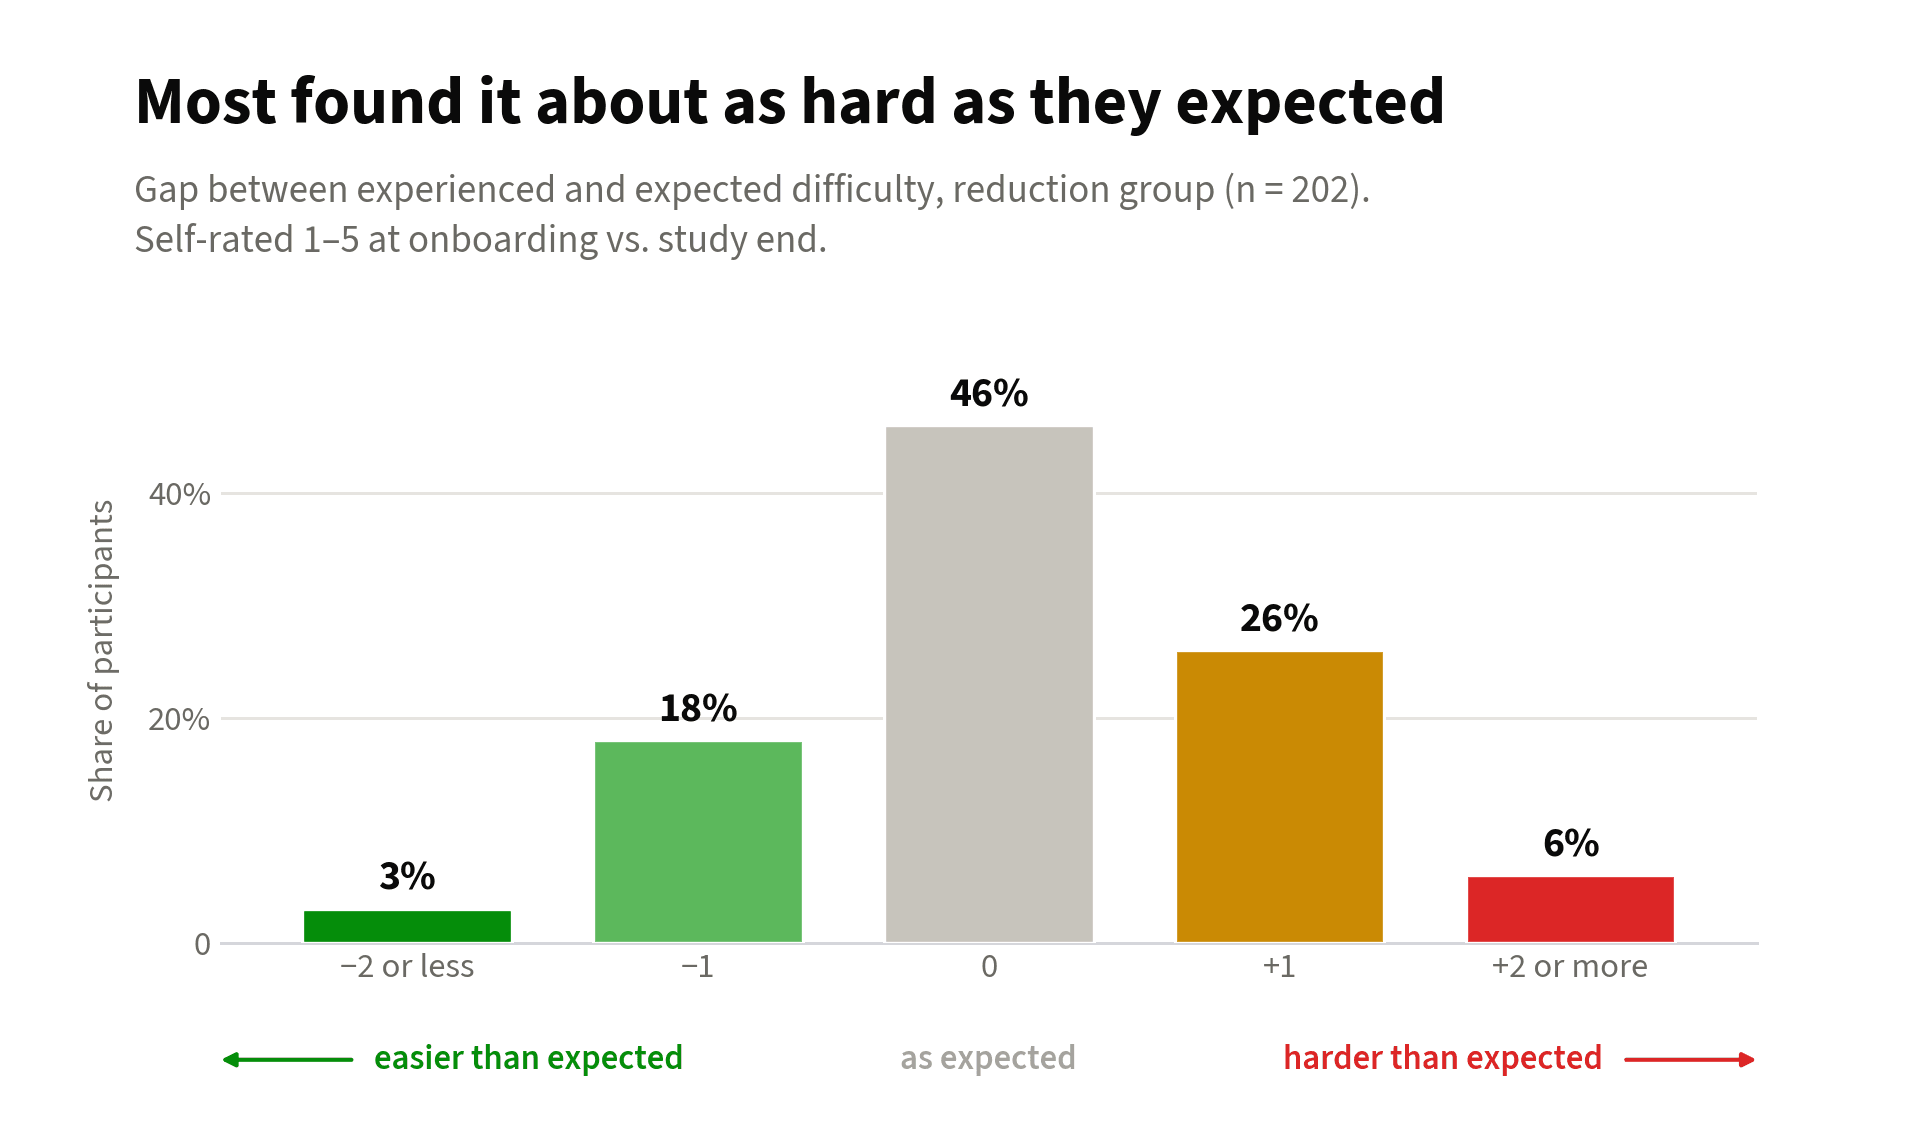
Before the study, participants were asked to rate how difficult they expected reducing animal product consumption would be. After the study, they rated how difficult it had actually been. We took the difference between these two ratings to see how well their expectations matched their experience.
Almost half of participants found it about as difficult as they expected and more than 90% of participants found it the same, a little easier, or a little harder.
The most common difficulty was cravings, not protein
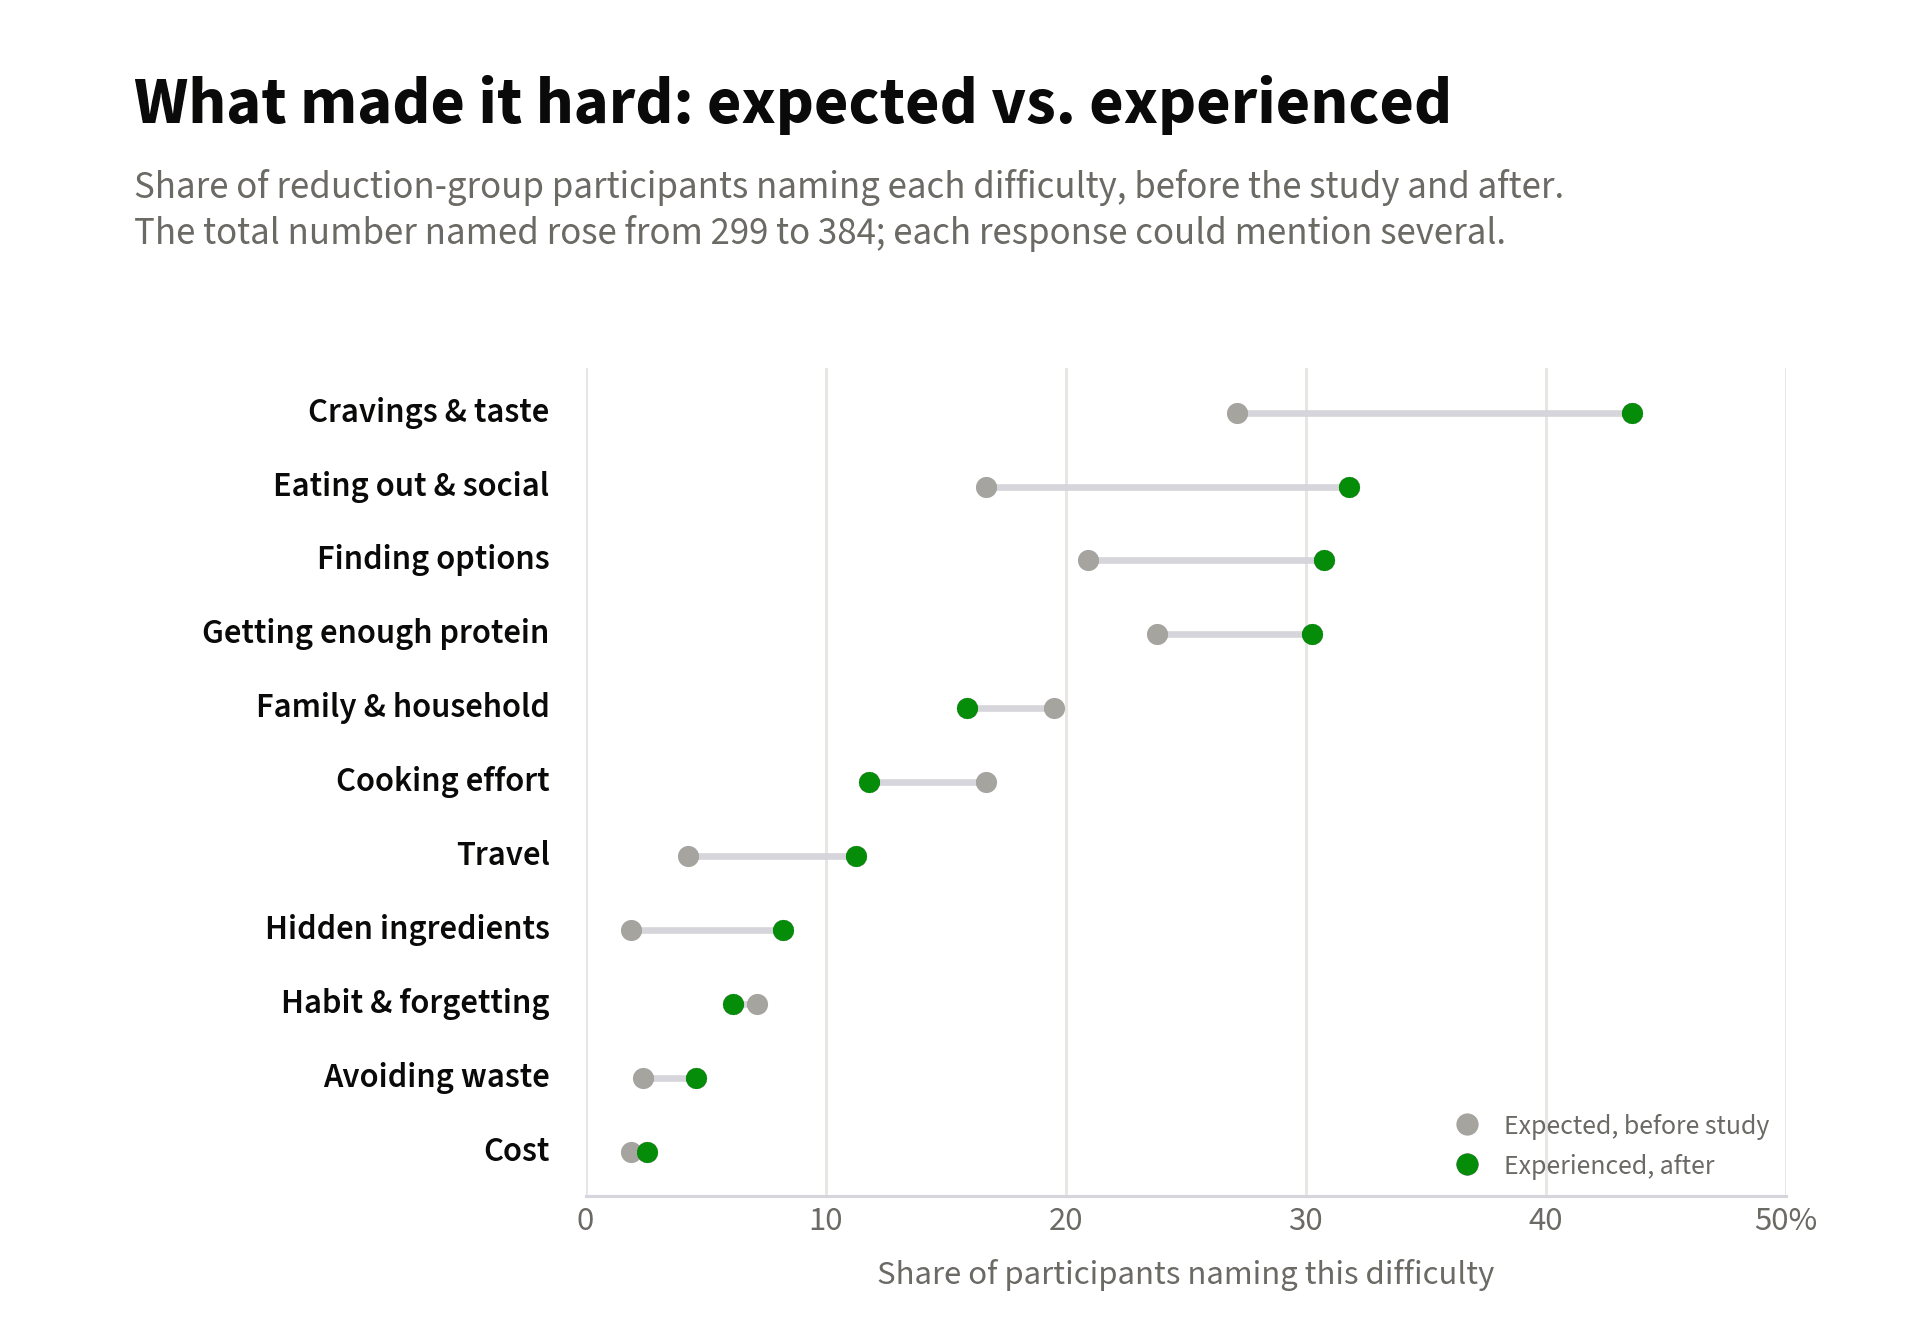
Before the study, participants listed the difficulties they expected. At the end of the study, the reduction group listed the ones they had run into. We compared the two lists to see which difficulties became more or less common.
After the study, cravings were the most frequently reported difficulty: participants missed the flavor of meat and found it hard to give up dairy staples such as milk, cheese, and ice cream (up from 27% to 44%). Eating out and social meals ranked second: participants often ate at restaurants and gatherings without suitable options (up from 17% to 32%). Finding plant-based options elsewhere, from stocking food at home to locating adequate substitutes, also increased (up from 21% to 31%).
Getting enough protein and feeling full, one of the most common concerns at baseline, showed only a small increase (up from 24% to 30%) and ended up less common than the other difficulties.
Almost nothing tracked how much someone reduced
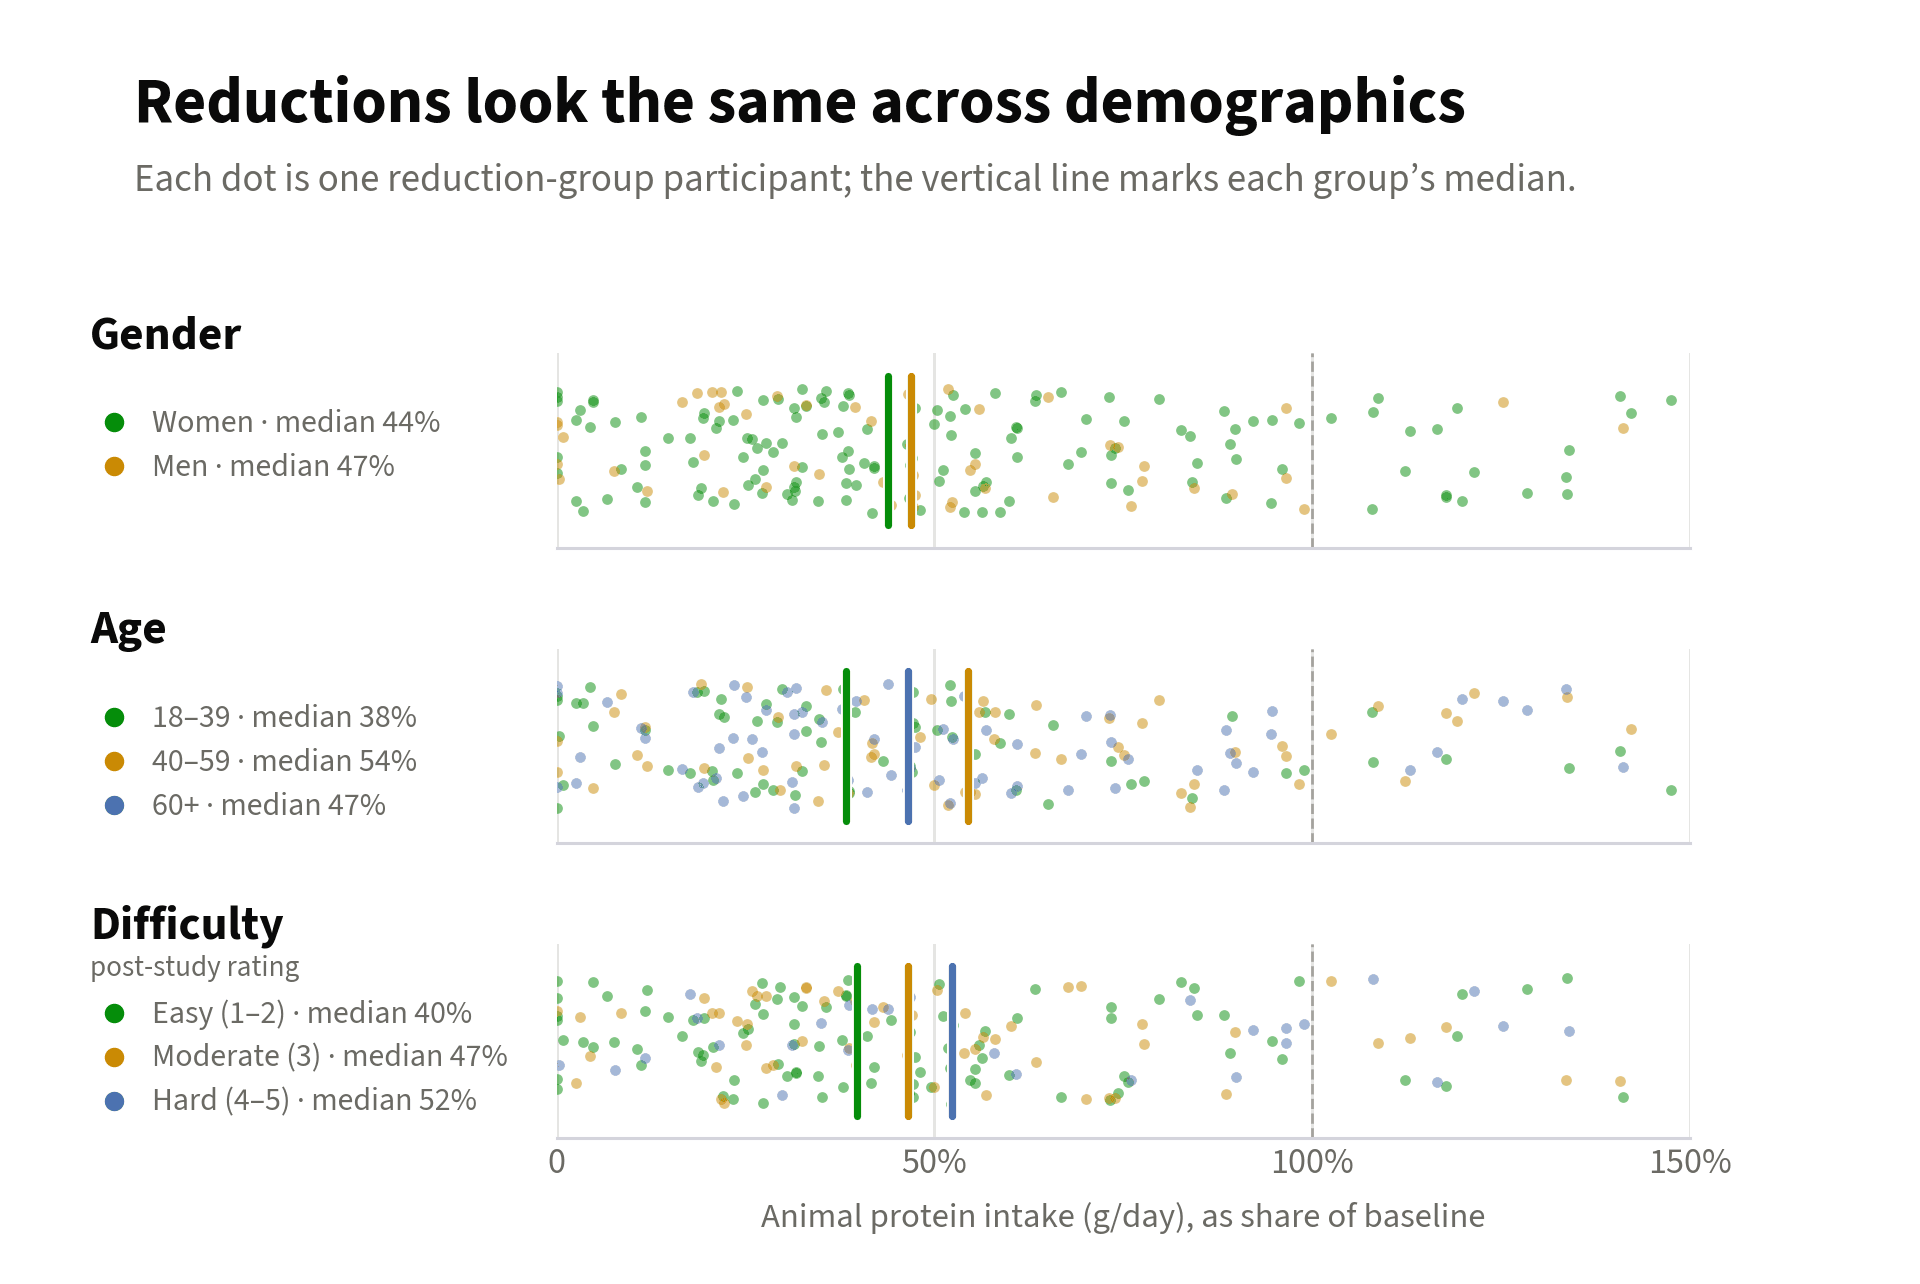
We tested whether reduction tracked gender, age, or self-assessed difficulty. We could not find a reliable link to any of them.
Men and women reduced almost identically, ending the two weeks eating a median of 47% and 44% of their baseline. The youngest participants also only reduced slightly more on average.
Surprisingly, the self-assessed difficulty before and after the study did not have any significant link to how much participants reduced:
- Participants who expected to find the experience easy didn’t reduce much more than those who didn’t.
- Participants who found the experience easy didn’t reduce much more than those who didn’t.
- Participants who underestimated the ease of the experience didn’t reduce much more than those who overestimated.
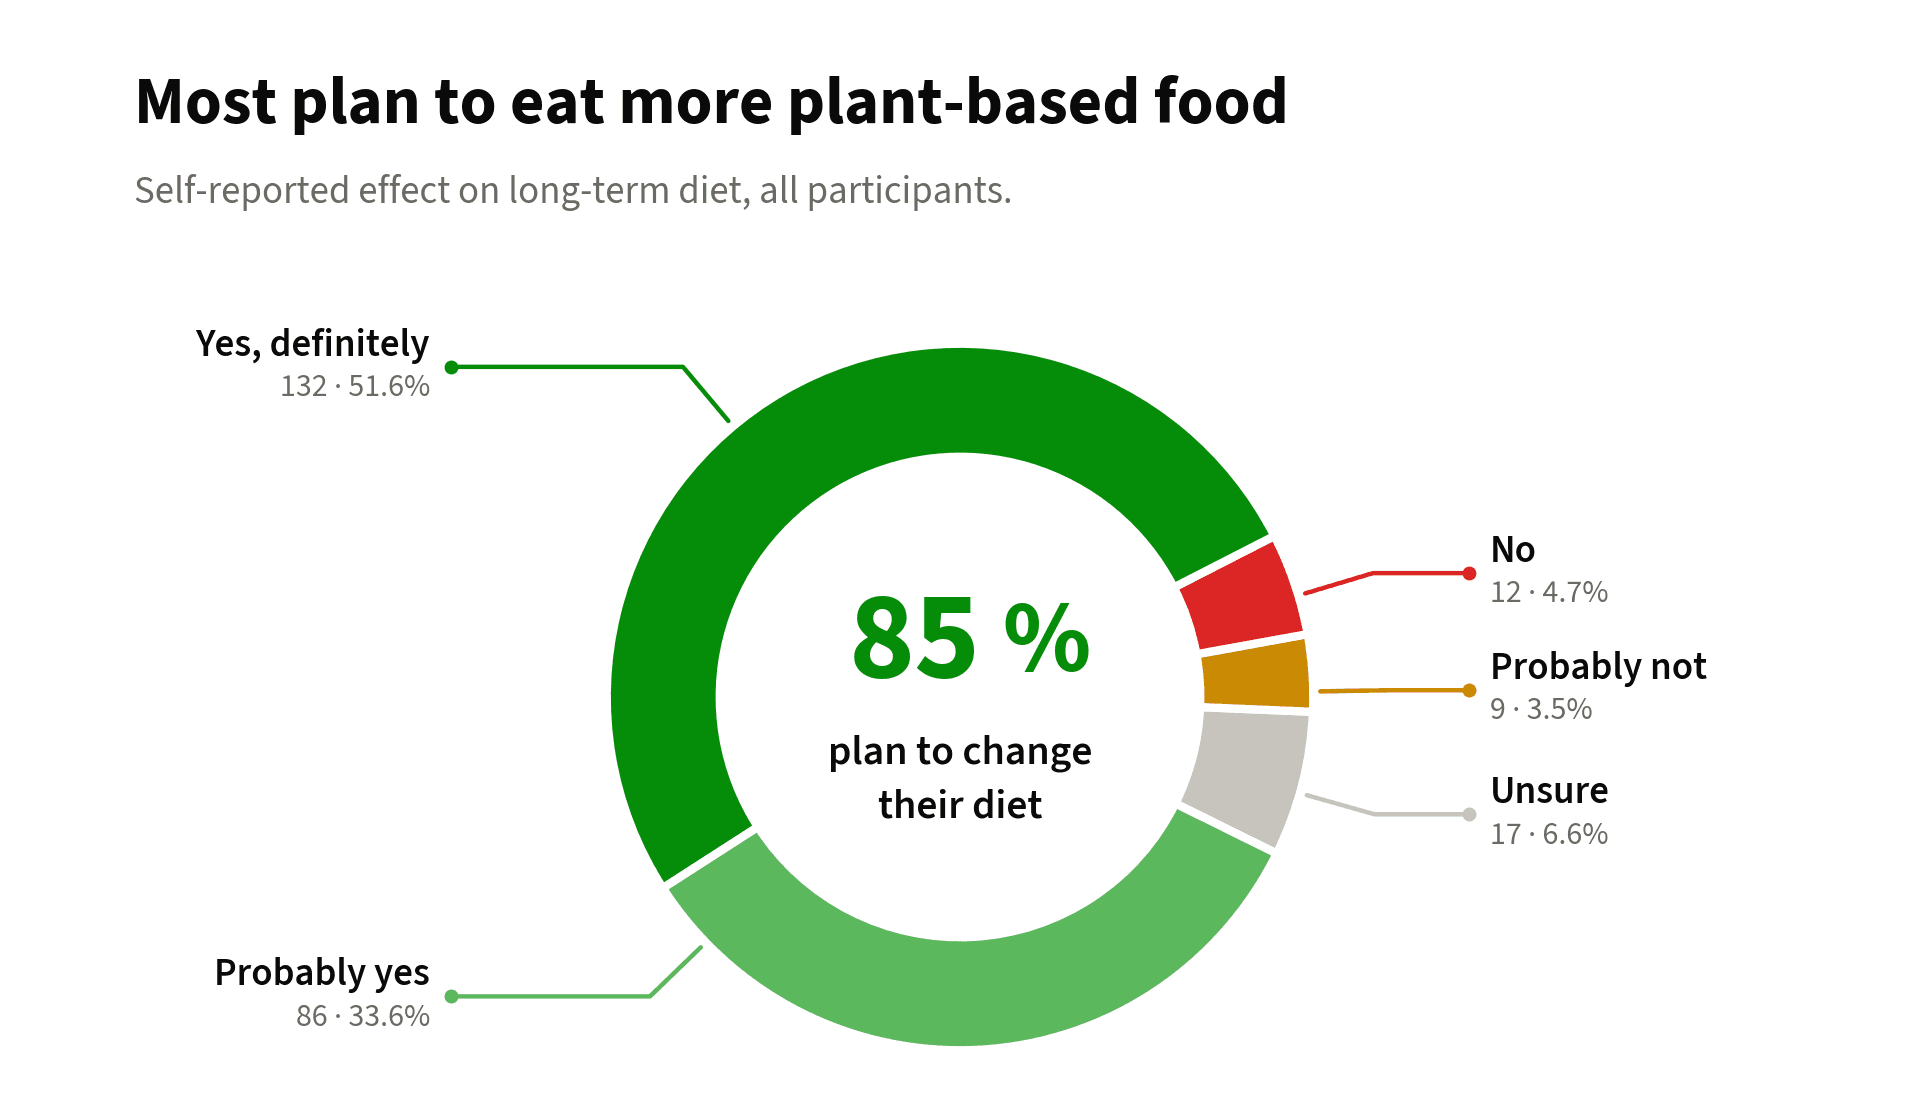
The vast majority of participants plan to eat more plant-based
At the end of the study, all participants were asked if they plan to incorporate more plant-based foods into their long-term diet as a result of the study. The vast majority of participants say they will probably or definitely do so.
Participants will be sent a follow-up survey 30 days after they completed the study to measure the extent to which they follow through on their intentions.
Methodology
Each day, participants texted what they ate. A language model (Claude Sonnet 4.6) was used to convert these free-form text responses into a structured list of foods participants consumed.
Each named food was then looked up in a reference table written into the script and converted into a low-to-high range of standard servings for each animal product category. The midpoint of the range was multiplied by a fixed per-category protein value (26 grams for meat, 20 for seafood, 8.5 for dairy, 6.3 for eggs). To test the sensitivity of our results, we recomputed each participant’s intake using food-specific protein estimates within each category. Both the per-participant totals and the estimated effect changed by less than 10%, and all conclusions were unchanged.
The daily grams of animal protein for each participant is the mean of their usable days. We exclude participants that did not log food consumption for three or more days. Inclusion rate was 59% for the comparison group and 60% for the reduction group. When using comparisons relative to participant baselines, the 14 participants with baselines under 5 grams were excluded.